// 01 — figure gallery
Main figures from the uploaded atlas
The gallery below uses rendered pages from the uploaded figure atlas so the public evidence surface remains self-contained.
This page is aligned to the uploaded SSI manuscript and figure decks. It is meant to help serious readers inspect the current public evidence without confusing simulation-stage results for clinical, epidemiological, or deployment proof.
The gallery below uses rendered pages from the uploaded figure atlas so the public evidence surface remains self-contained.
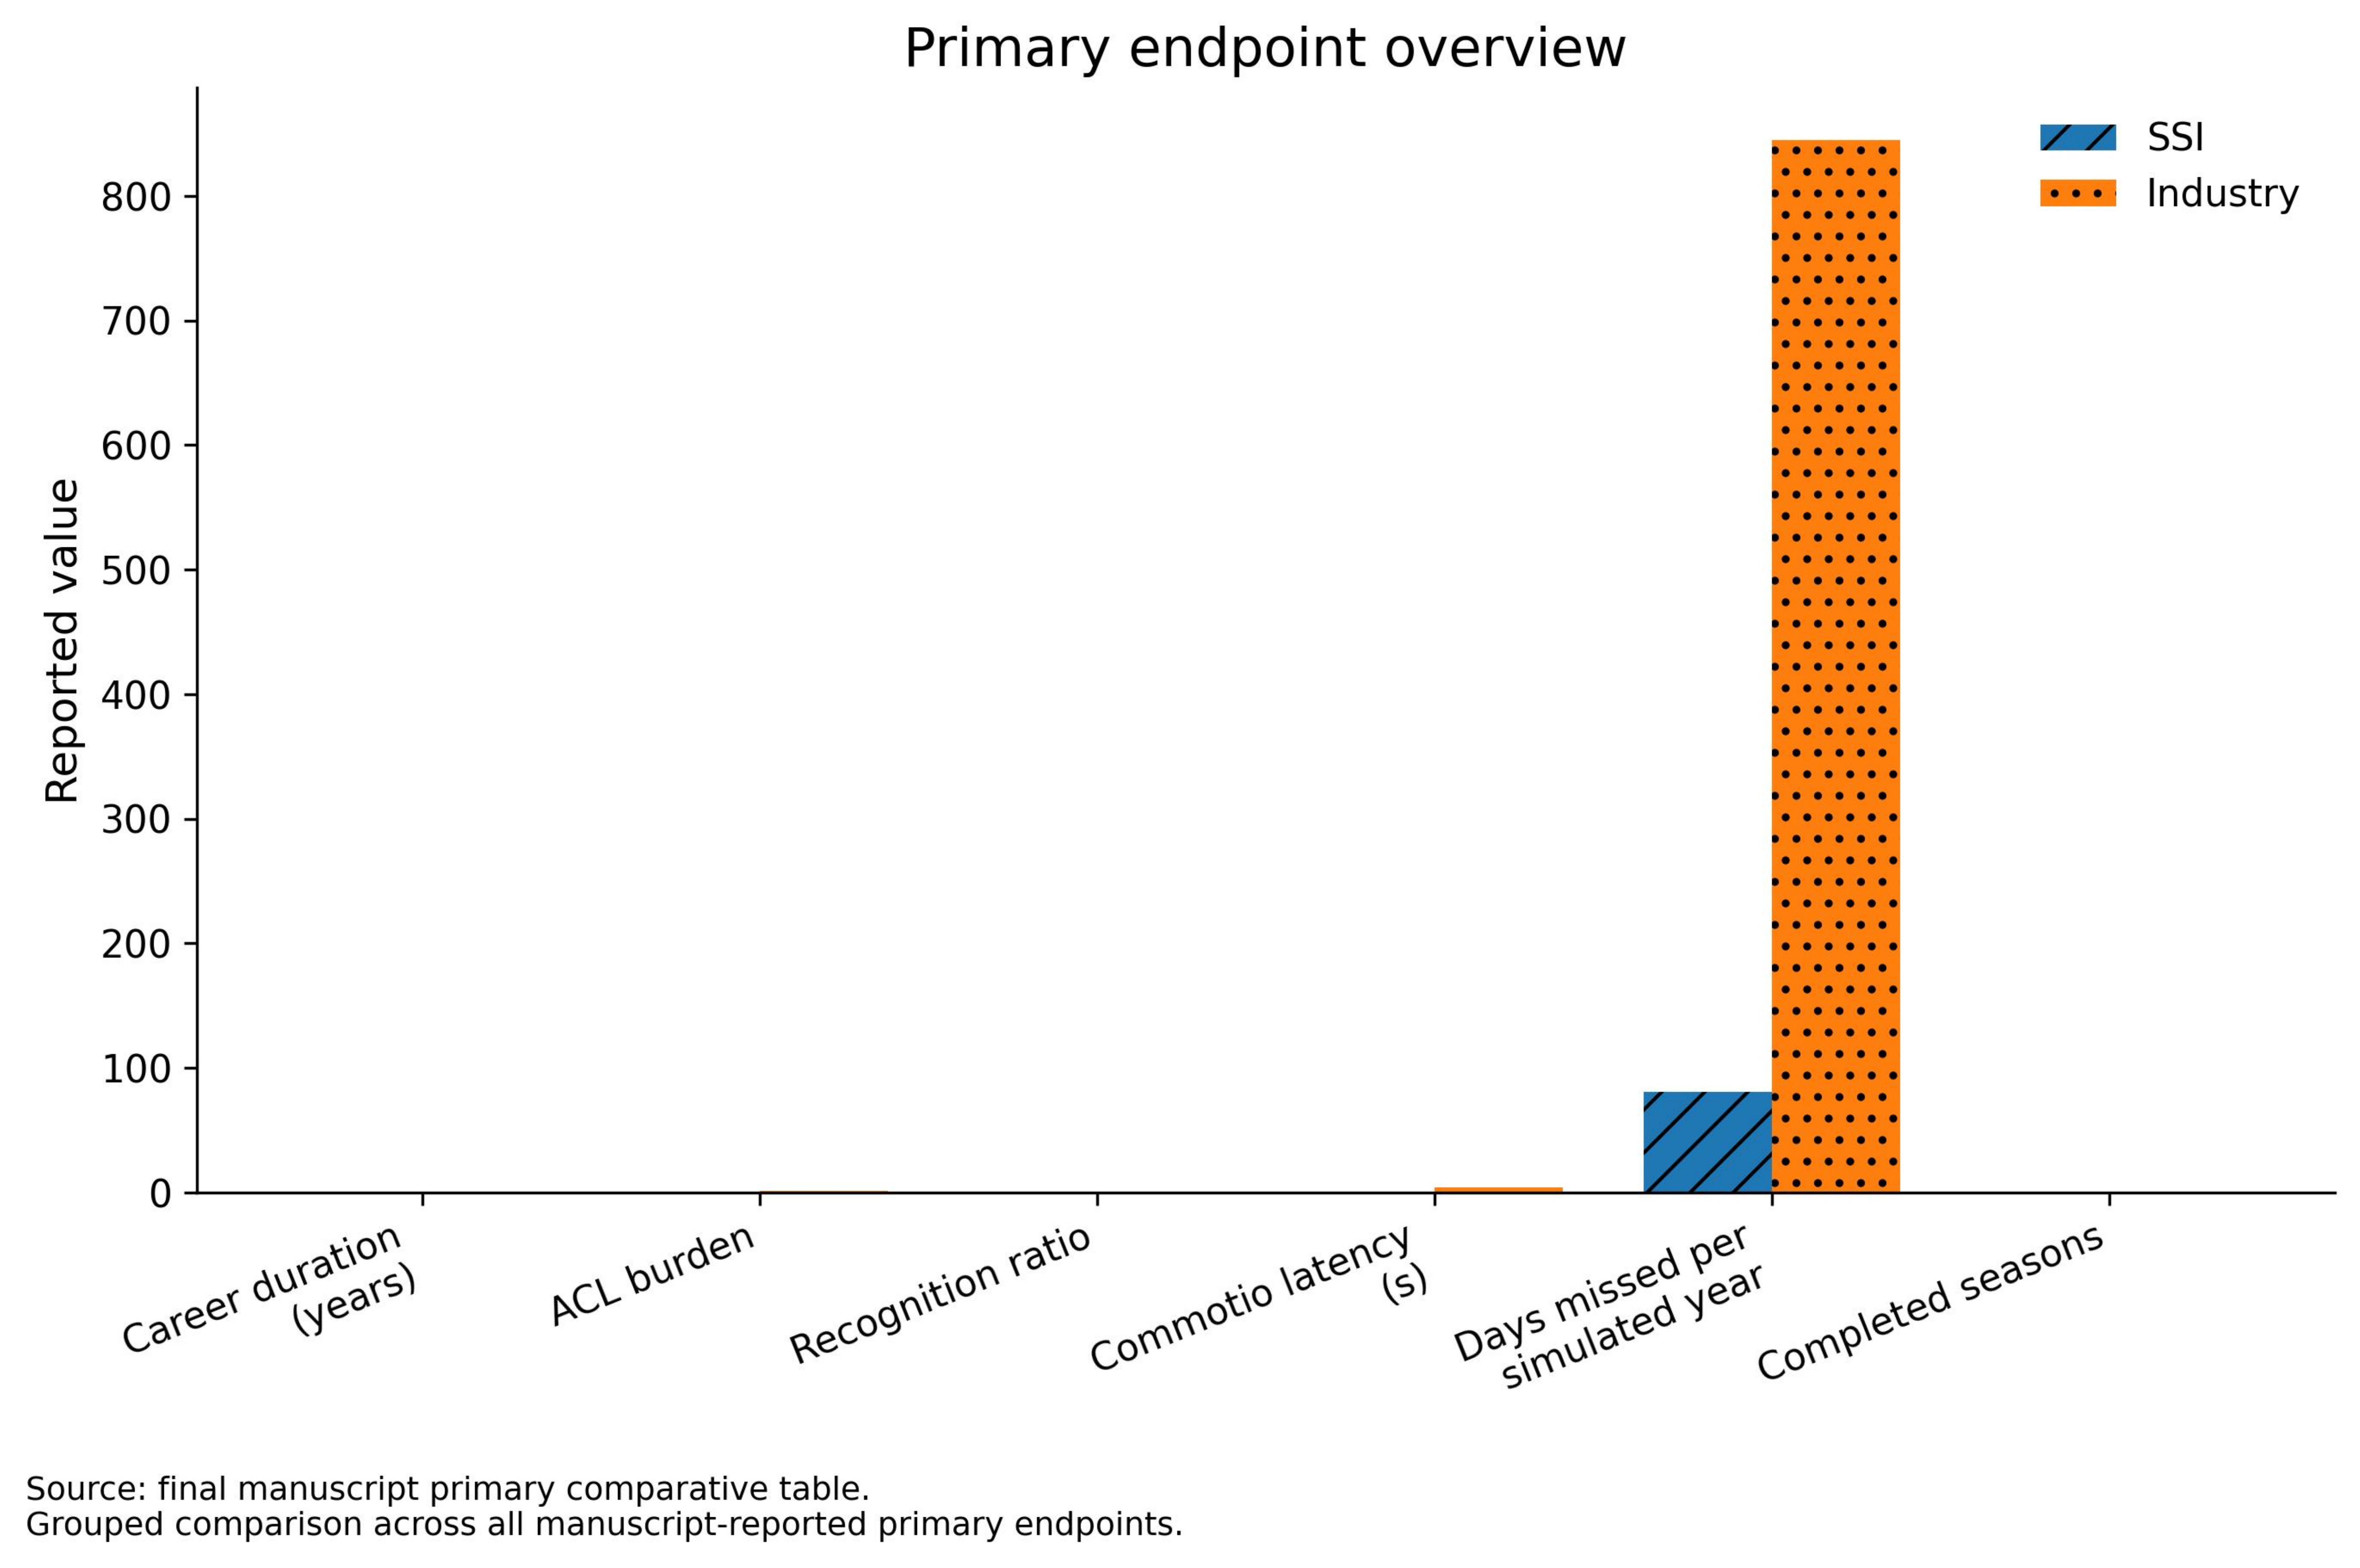
| Endpoint | SSI | Industry | Directional reading |
|---|---|---|---|
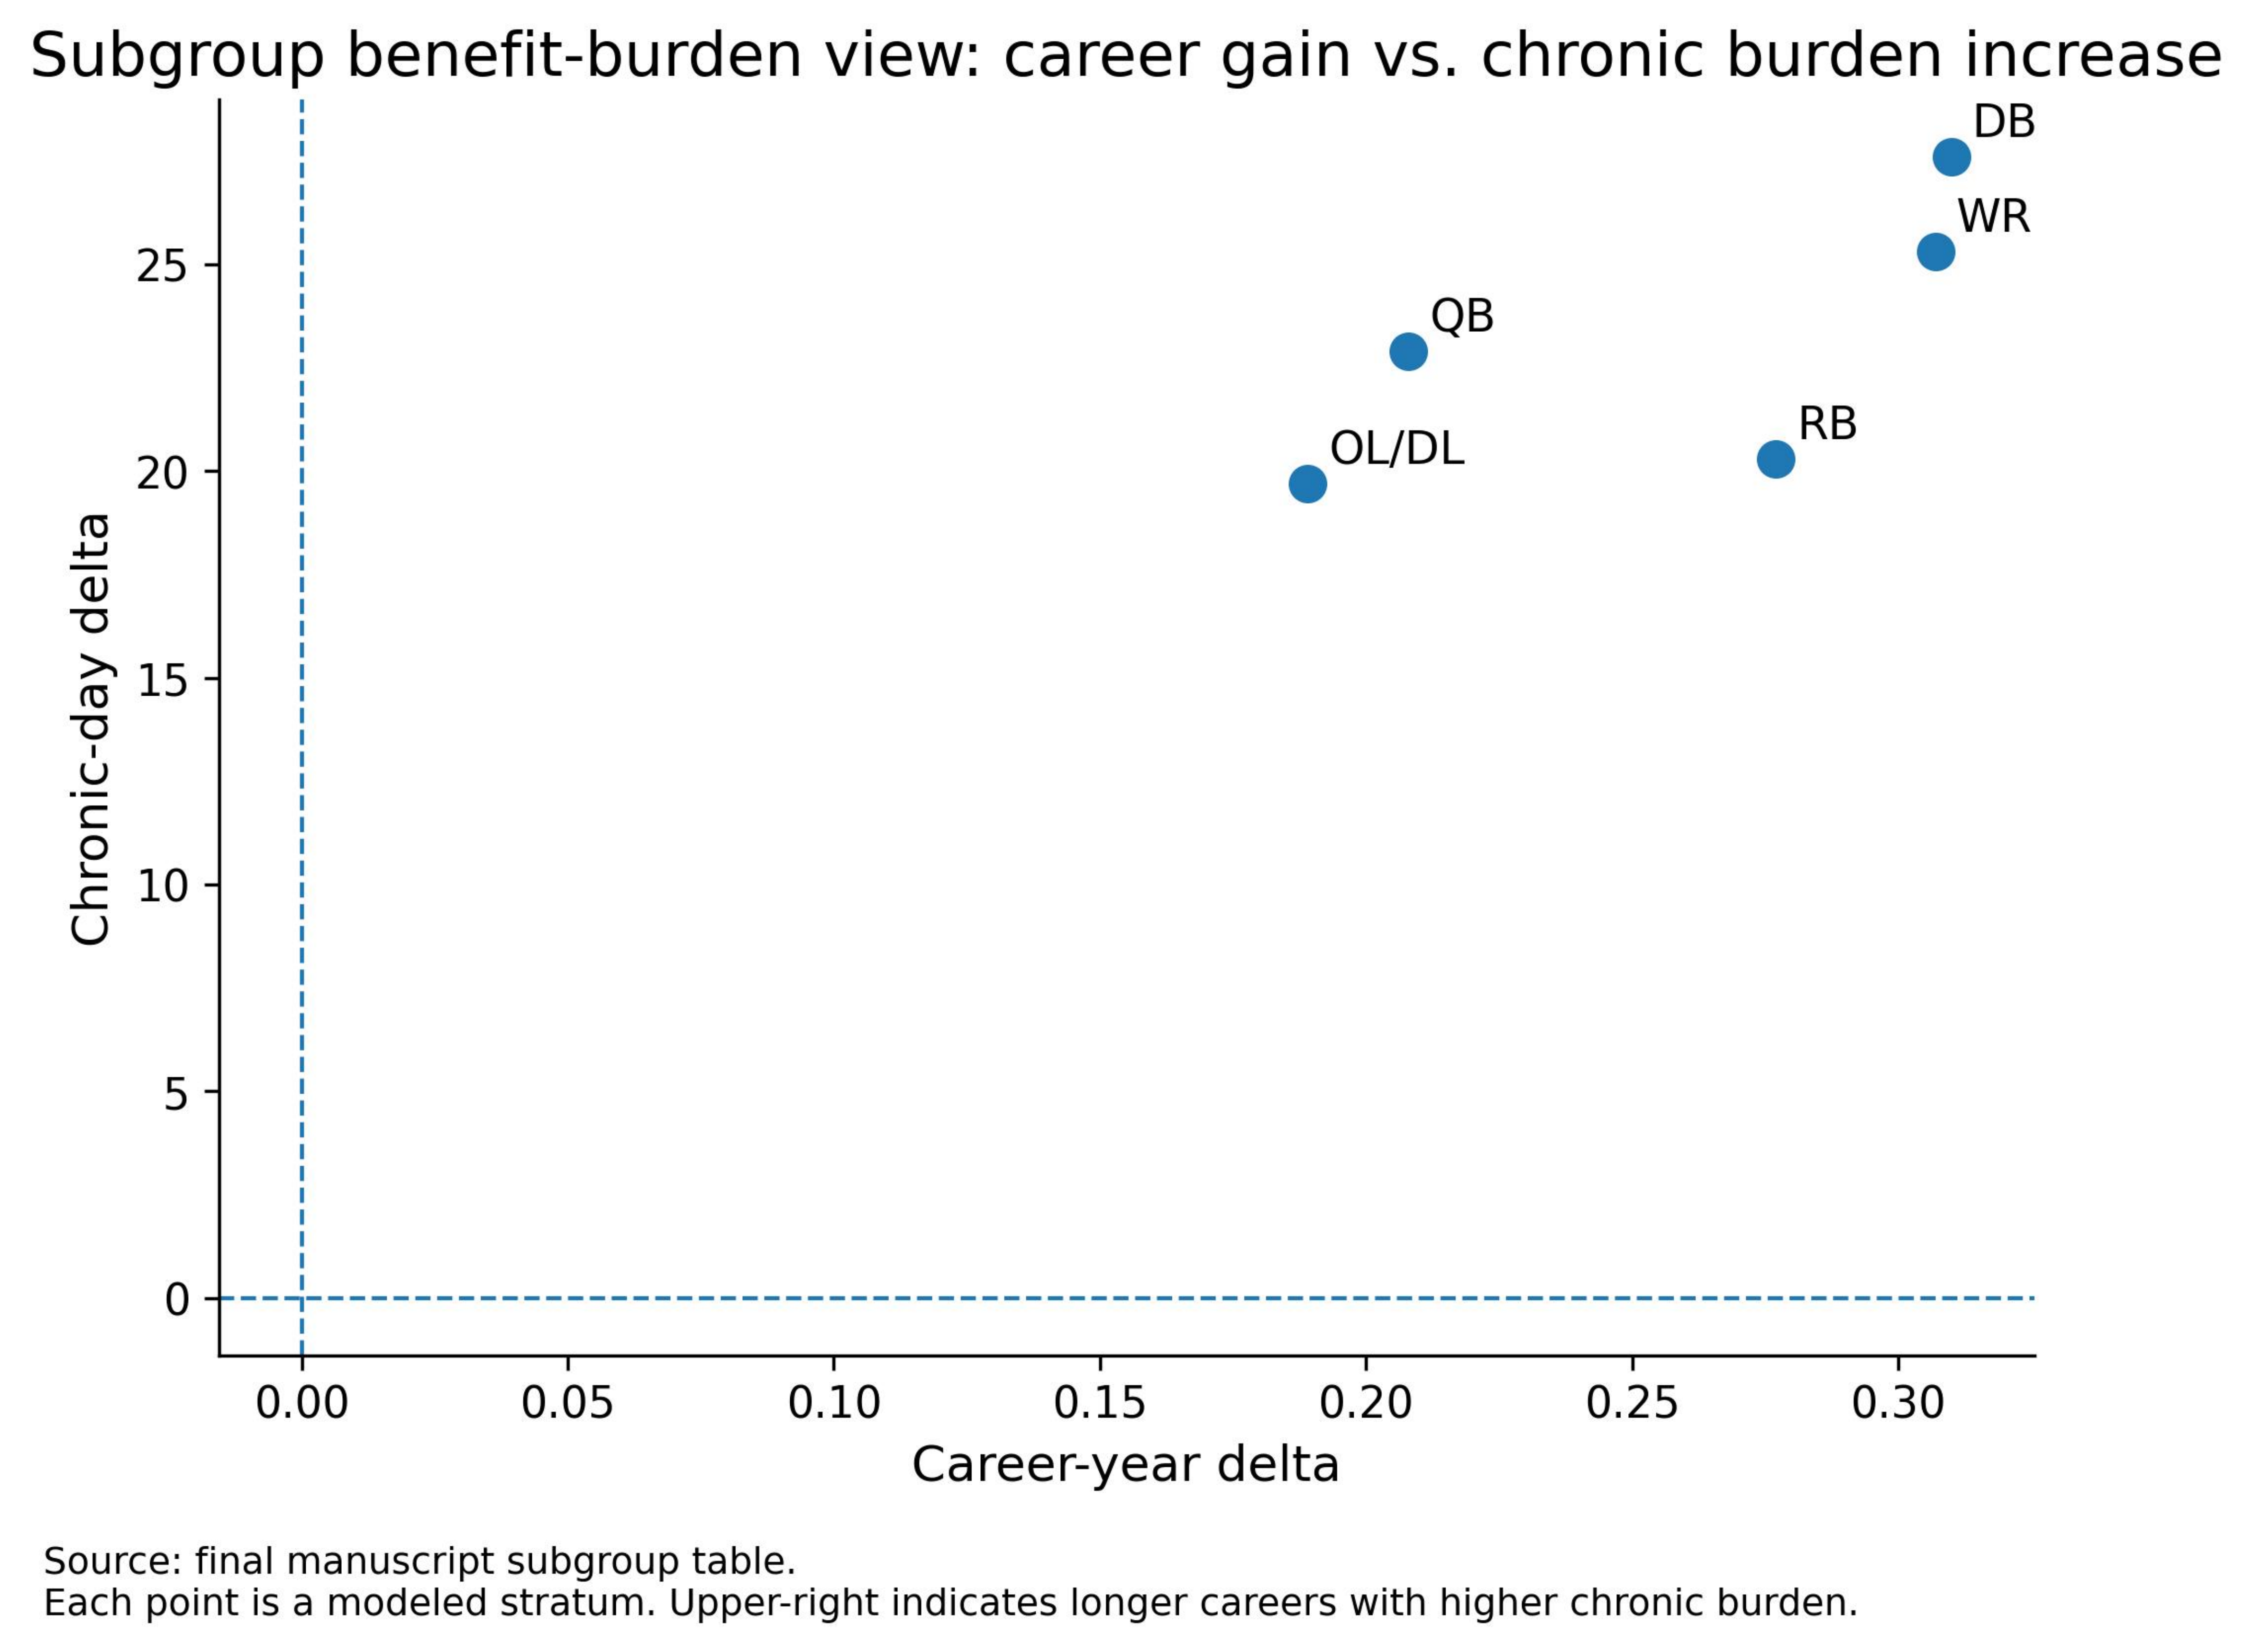
| Career duration (years) | 0.532 | 0.267 | SSI longer |
| ACL burden | 0.210 | 1.680 | SSI lower |
| Recognition ratio | 0.968 | 0.777 | SSI higher |
| Commotio latency (s) | 0.372 | 3.817 | SSI faster |
| Days missed per simulated career-year | 80.9 | 844.8 | SSI lower |
| Completed seasons | 0.098 | 0.009 | SSI higher |
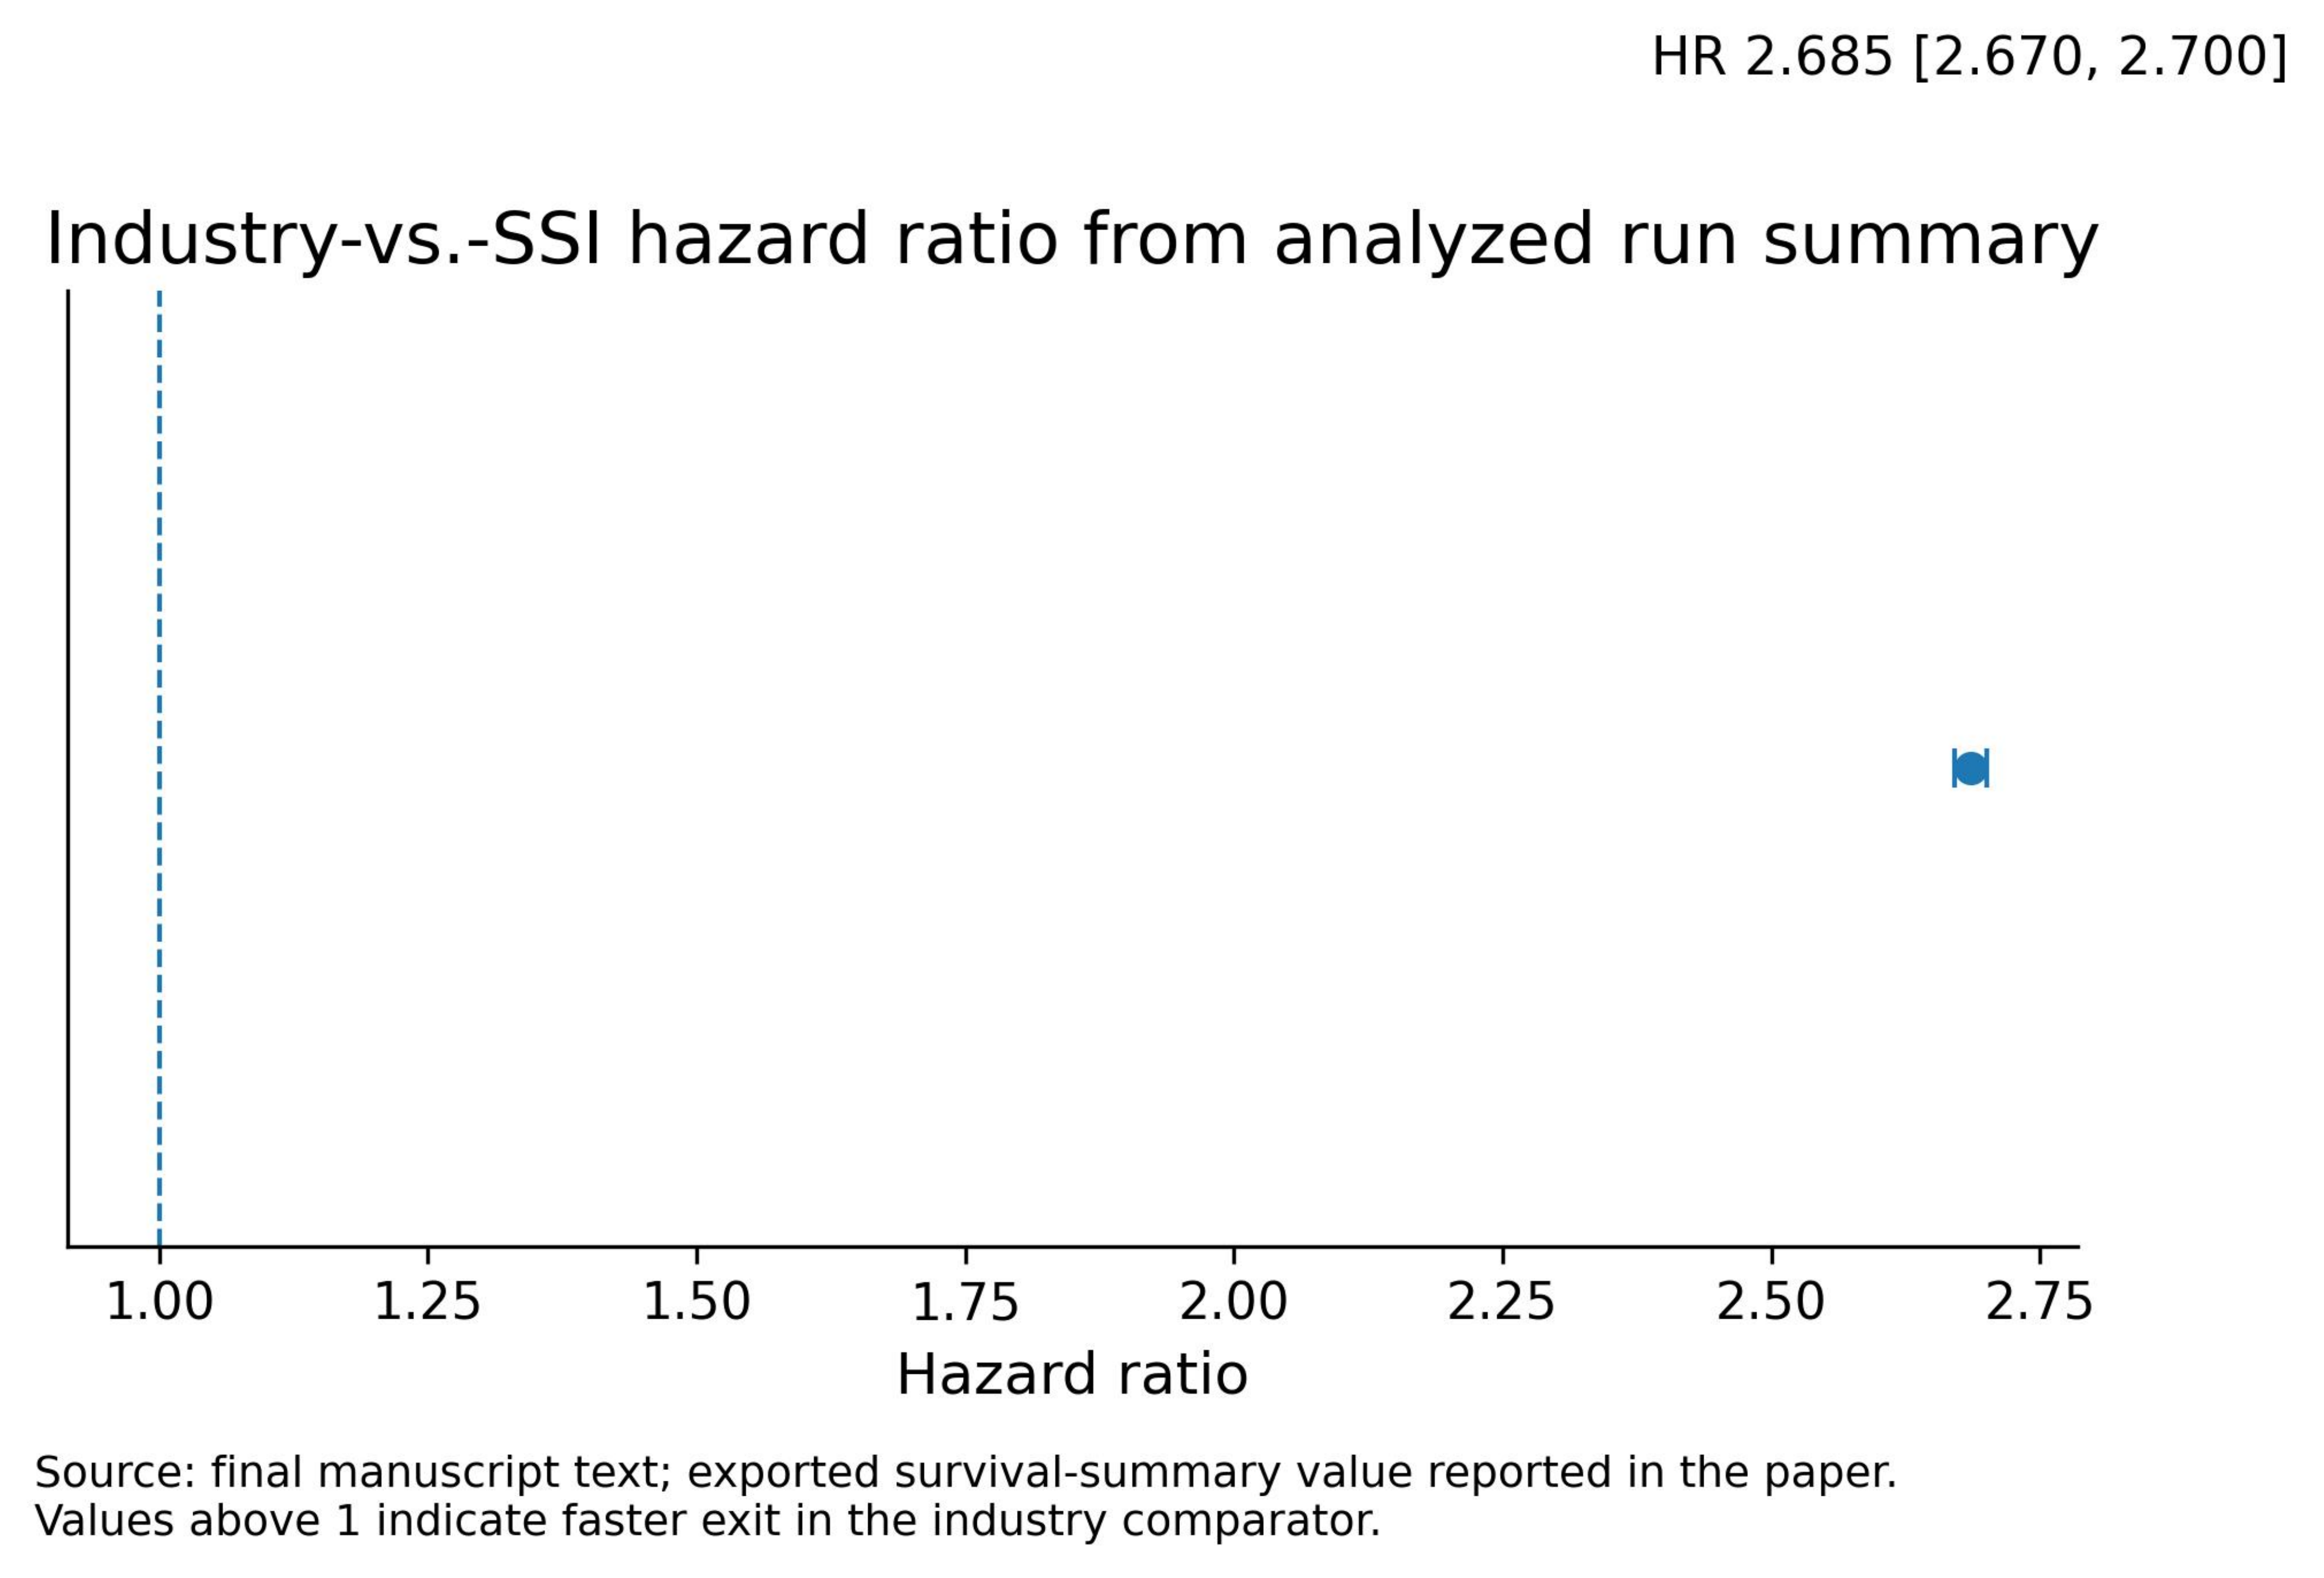
| Hazard ratio (industry vs SSI) | reference | 2.685 [2.670, 2.700] | Industry exits faster |
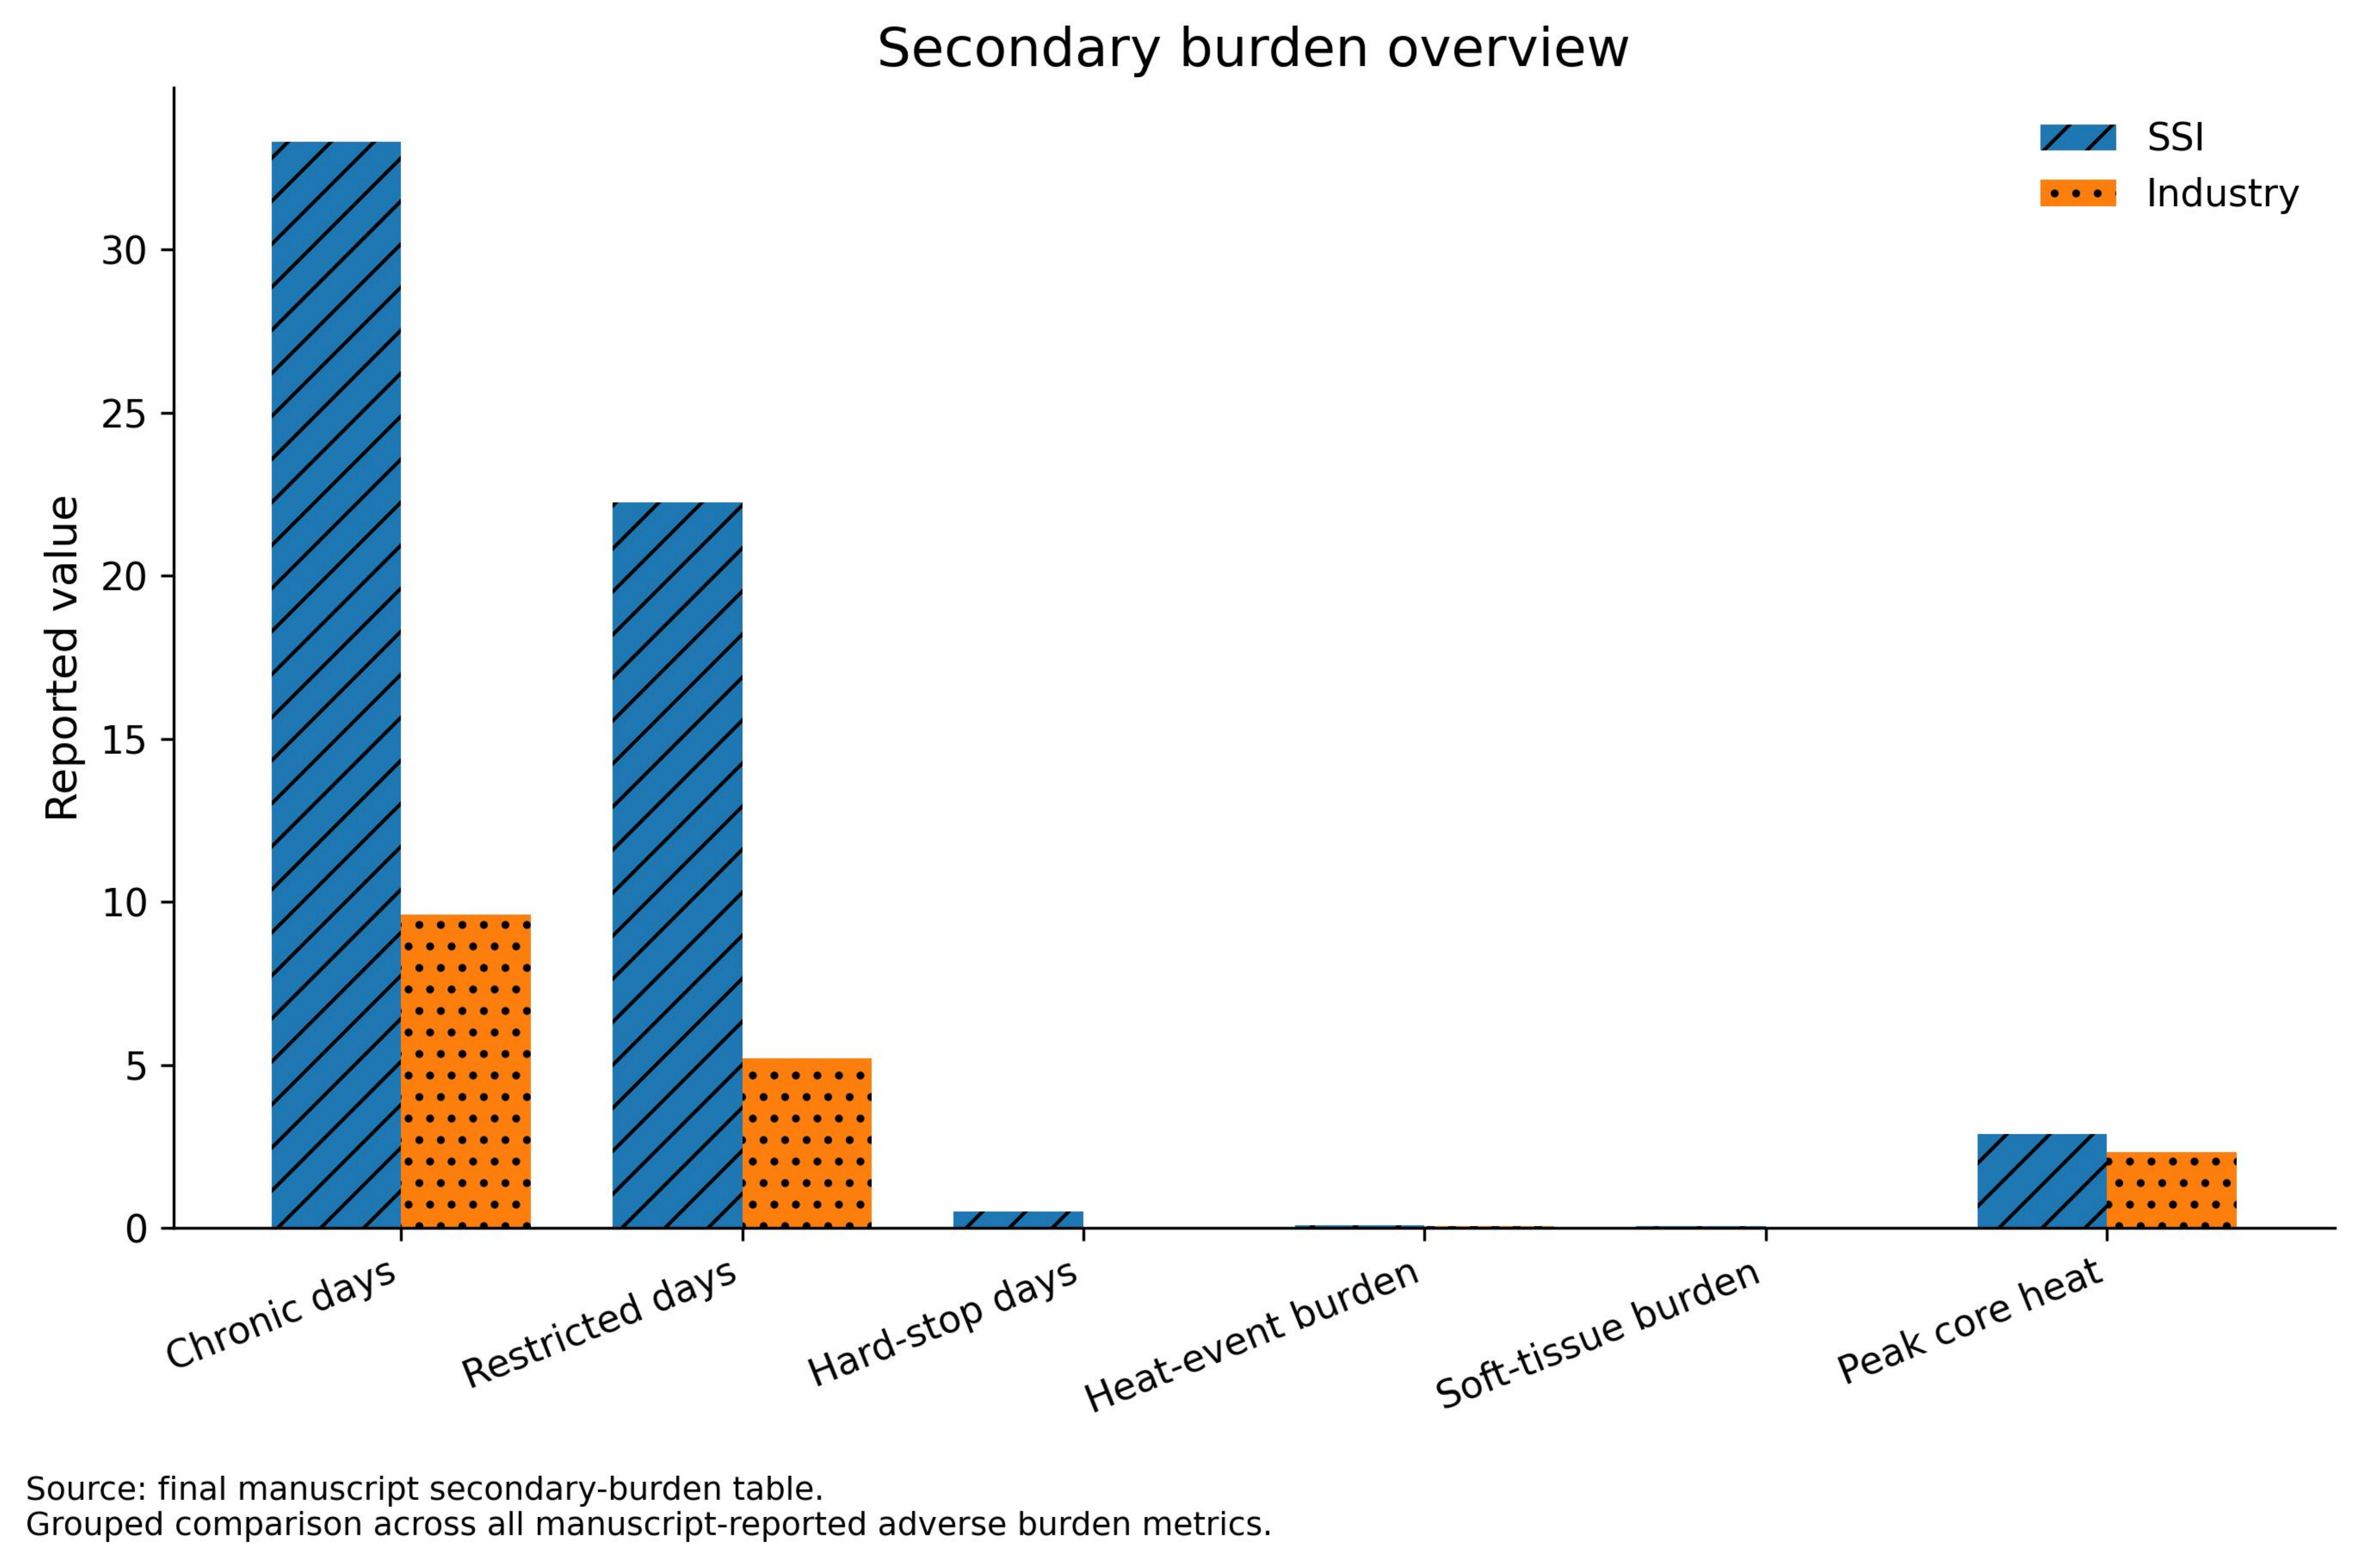
| Secondary burden metric | SSI | Industry | Reading |
|---|---|---|---|
| Chronic days | 33.3 | 9.60 | Higher under SSI |
| Restricted days | 22.2 | 5.19 | Higher under SSI |
| Hard-stop days | 0.494 | 0.000 | SSI imposes hard stops |
| Heat-event burden | 0.0759 | 0.0515 | Higher under SSI |
| Soft-tissue burden | 0.0553 | 0.0245 | Higher under SSI |
| Peak core heat | 2.876 | 2.332 | Higher under SSI |
Use the uploaded PDFs for source review.
If you want the next pass to target journal submission optics, figure polishing, or collaboration readiness, route the note with the exact artifact in question.